
HZ 3.5 Performance: Selector Imbalance
Performance, especially predictable performance, becomes a higher priority with every Hazelcast release. One of the performance issues in releases prior to 3.5 is that between benchmarks – every benchmark gets a fresh cluster – there often is a large performance variation, even though the performance during a benchmark is pretty stable.
e.g. If we have a basic map-test that is run executed using our distributed Load/Performance testing tool Hazelcast simulator.
class=com.hazelcast.simulator.tests.map.StringStringMapTest
threadCount=40
keyLocality=Random
keyLength=20
valueLength=100
keyCount=10000
valueCount=1000
putProb=0.0
basename=map
logFrequency=100000
probe-getLatency = latency
probe-putLatency = latency
This map test call IMap.get from random members in an IMap. If we run on our old 4 node test lab (4 dual socket Xeon Sandy Bridge Boxes with 1 GbE network) for 5 minutes per run, and we run it 10 times, we get the following data:
| Run | Operations/second |
|---|---|
| 1 | 487785.57666666666 |
| 2 | 412653.88 |
| 3 | 527906.43 |
| 4 | 492721.67 |
| 5 | 438349.95666666667 |
| 6 | 435373.49 |
| 7 | 516845.0466666667 |
| 8 | 457152.36666666664 |
| 9 | 439493.16 |
| 10 | 496815.06666666665 |
| Operations/second | |
|---|---|
| min | 412653.88 |
| max | 527906.43 |
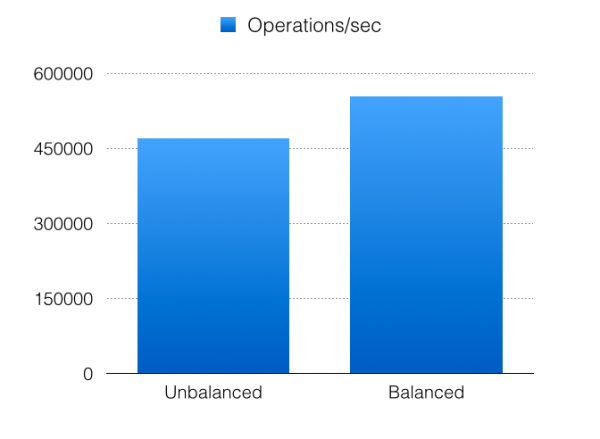
| avg | 470509.664333333 |
As you can see, the difference between the minimum and maximum is massive. The fastest run is 28% faster than the slowest run. Having such large performance variations between runs is super annoying:
- it makes Hazelcast harder to use in a production environment because it’s difficult to predict what performance will be like.
- it makes performance tuning nearly impossible because we don’t know if we made something faster or we had a lucky run.
After adding all kinds of ad hoc metrics in the system to figure out what was happening, we finally struck gold when we began tracking the number of events processed per selector.
in-0.readEvents=1519057 in-1.readEvents=6076514 in-2.readEvents=4 out-0.writeEvents=13867449 out-1.writeEvents=6 out-2.writeEvents=8701814
As you can see, the first input and output selectors are completely out of balance compared to the other selectors. You might ask yourself, “What do these selectors do?”. In Hazelcast, we make use of non-blocking IO in combination with Selectors. This makes it possible to have many connections being handled by just a few threads. Each selector is handled by a single thread, and by default we have 3 input selectors and 3 output selectors. If an input-thread is waiting for data to read from the socket buffers, it will receive a read-event from the input-selector and the ‘readEvents’ is incremented. And every time an output-thread receives a write event, after waiting for space in the socket buffers to be available, ‘writeEvents’ is incremented.
In a 4 node cluster there should be 3 connections per node, since a node doesn’t need to connect itself. Using 3 input and 3 output selectors, the connections should be spread perfectly over the selectors; but as you can see, it isn’t the case. The consequence of this imbalance is that the member gets an unbalanced load over the selectors and this causes the system to perform suboptimally. Once in a while you get super great performance when every node is perfectly balanced, but in most cases most of the members have an imbalance.
Why does the imbalance happen?
The next question to answer is why does the imbalance happen? The answer is in the concurrent startup of the Hazelcast nodes. When nodes have not formed a cluster, they try to connect to all the other well known IP addresses and this can lead to duplicate connections between members when they try to contact each other. In the end, only one connection is used, but this duplicate connection causes a problem in the round robin connection-to-selector assign mechanism.
To prove this theory I added a hack, which is disabled by default, that forces connections from a single host to always end up on the same selector. The hack can be enabled in Hazelcast 3.4 using the following JVM setting ‘-Dhazelcast.selectorhack.enabled=true’. It should only be used for experimentation purposes.
After I added the hack and did some benchmarking, the selectors are now perfectly balanced:
in-0.readEvents=2220801 in-1.readEvents=2412388 in-2.readEvents=2514934 out-0.writeEvents=6159812 out-1.writeEvents=6108344 out-2.writeEvents=6155557
But what kind of impact does the selector-hack have on performance? When we it run again, but with the selector-hack enabled, we get the following data:
| Run | Operations/second |
|---|---|
| 1 | 568136.3033333333 |
| 2 | 580225.72 |
| 3 | 550599.2766666666 |
| 4 | 560531.0966666667 |
| 5 | 548103.9666666667 |
| 6 | 544054.8133333334 |
| 7 | 554470.4433333334 |
| 8 | 539209.21 |
| 9 | 552880.8966666666 |
| 10 | 532643.53 |
| Operations/second | |
|---|---|
| min | 532643.53 |
| max | 580225.72 |
| avg | 553085.525666667 |
The performance difference between minimum and maximum is just 9%; compare that to the 28% performance difference when the hack is disabled. Apart from that, the average throughput has increased by 18%!
With the selector-hack disabled once in a while, you get very good performance if there are no imbalances. With the selector-hack enabled, you will always get this good performance.
IO-Balancer
In Hazelcast 3.5 we replaced the selector-hack by a proper solution called the IO-balancer. It periodically inspects the selectors and checks for imbalances. If an imbalance is detected, the busiest connection from the busiest selector with at least 2 connections, is migrated to the least busiest selector. By default, the IO-balancer checks for such a migratable connection every 20 seconds, but this can be changed using the ‘-Dhazelcast.io.balancer.interval.seconds=seconds’ property. If set to a negative value, the IO-balancer is disabled.
The IO-balancer isn’t only useful for the concurrent node startup problems; it’s also very useful in environments where members join and leave the cluster. What’s in perfect balance at some point in time, might be out of balance a bit later if a member joins or leaves. The other cool thing is that clients rely on the same connection mechanism as members, so they get rebalanced as well! Clients are in most cases less permanent than cluster members.
In Hazelcast 3.6 we’ll be including a new feature called ‘Metrics’. It’ll expose all kinds of internal probes and periodically logs it to file. This should provide a lot of insight into what’s happening. Of course, the selectors are one of the key probes in the metrics system.
Stay tuned! Don’t forget, you can get a 30 day free trial to check out Hazelcast Enterprise! Download now »